
News, Developments and Insights
Check here for the latest news from United Farmers Cooperative and all the developments and insights that affect you and your operation. We’re here to keep you accurately informed and to help you thrive in all aspects of your business.
Sign up for our latest announcements and be sure to check out our latest issue of Fieldviews to hear the latest cooperative news from our agronomy, feed, grain, energy and administrative teams.
RACHEL HOLMQUIST, COMMUNICATIONS & TALENT ACQUISITION SPECIALIST Hiring has become an immense challenge across nearly all occupations and industries over the past few years. With unemployment rates remaining low and more workers retiring or leaving the workforce, the competition for […]
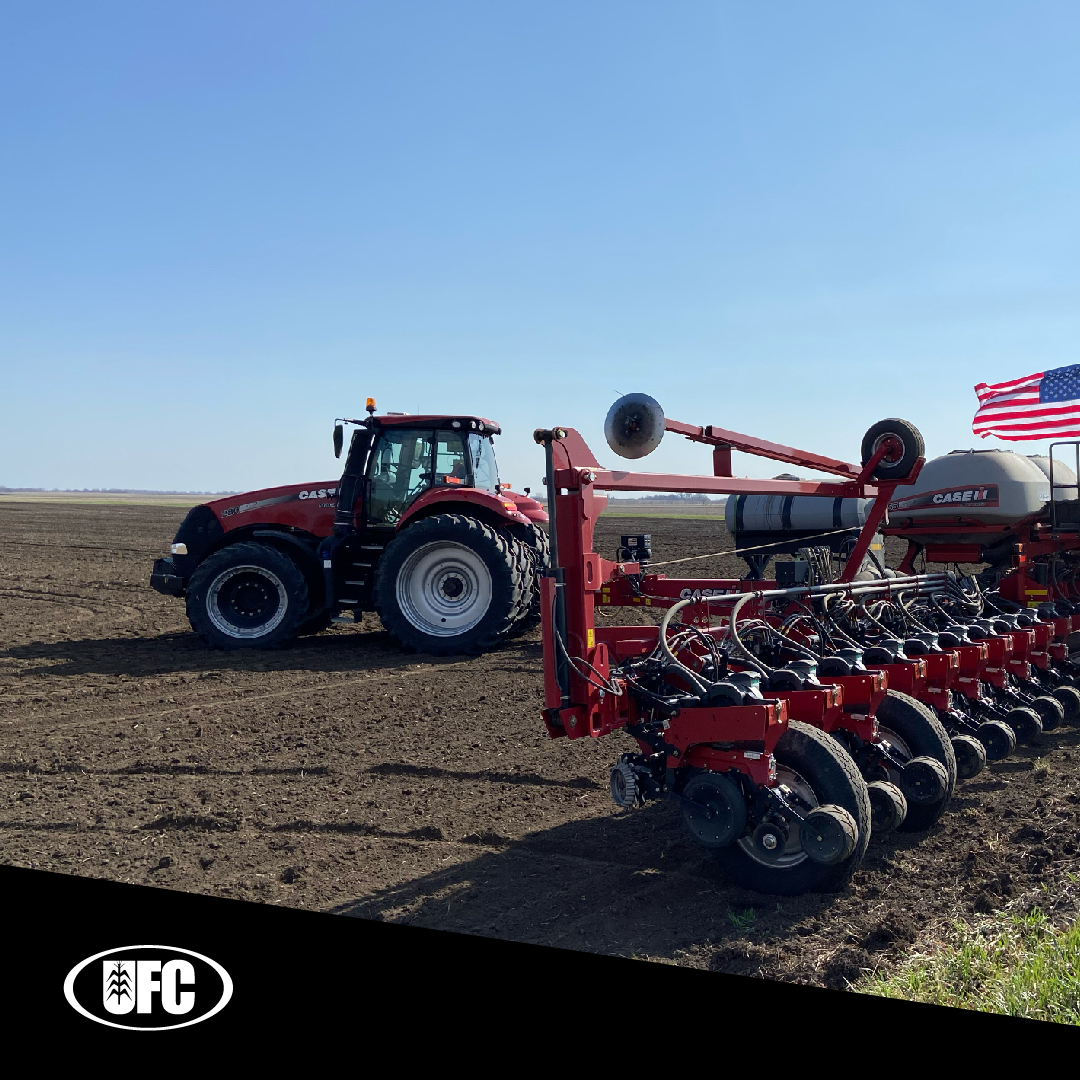
DOUG HOFFMANN, SAFETY MANAGER Spring is finally here, and things are ramping up on the farm. But as we rush to get crops in the ground, it’s easy to cut corners and take shortcuts with safety. Let’s take a moment […]
DARV TURBES, VICE PRESIDENT OF ENERGY At the last annual meeting, your board of directors and leadership team reported on the financial strength of your cooperative. The financial success was made possible largely thanks to your support and loyalty. Because […]
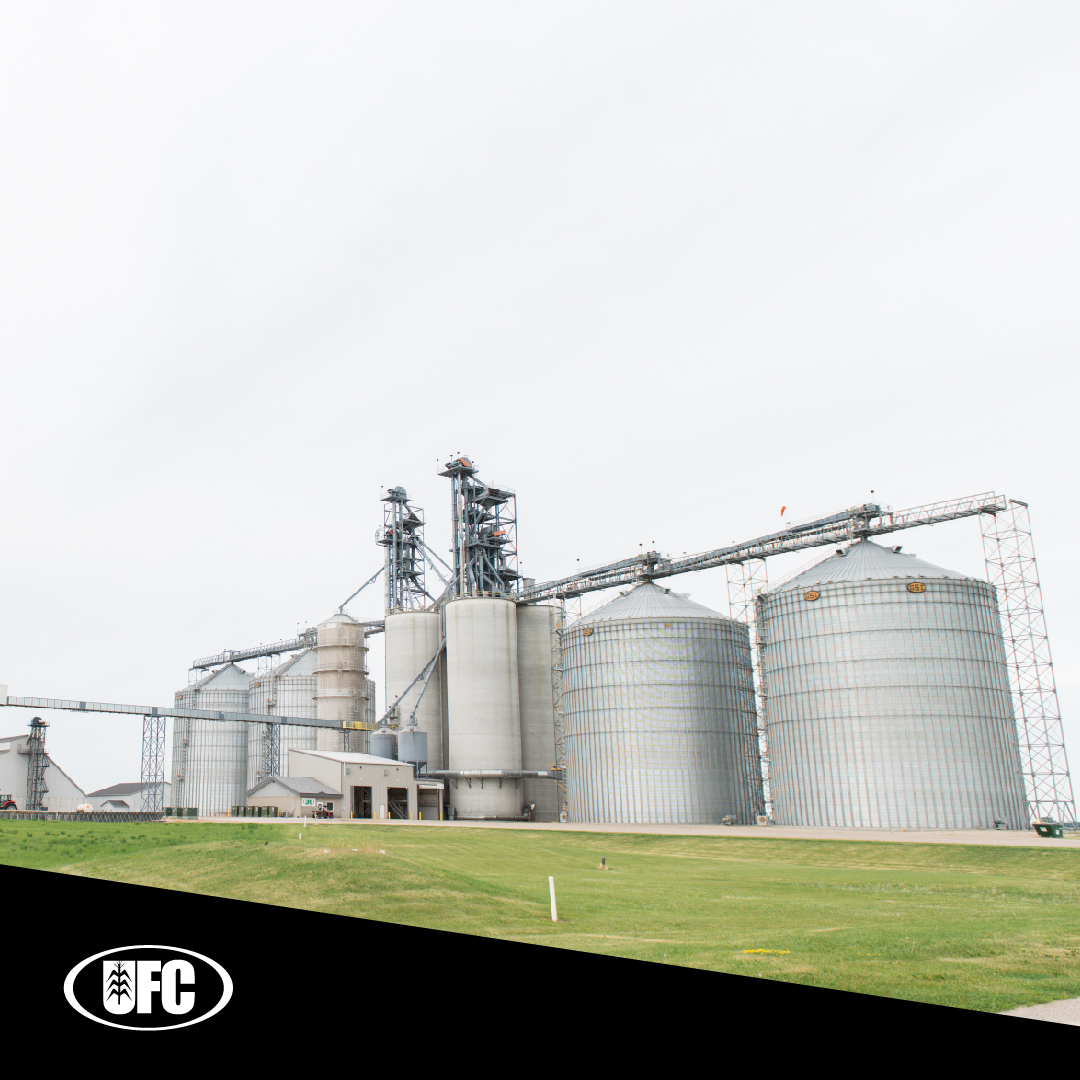
JASON TEWS, VICE PRESIDENT OF GRAIN & FEED Change is in the air this spring, and I’m energized by the opportunities ahead for our cooperative and the growers and farmers we serve. While change can feel uncertain sometimes, the path […]
JIM CARLSON, VICE PRESIDENT OF AGRONOMY I’ll start off by getting straight to the point: If you haven’t done so already, now is the ideal time to connect with your UFC account manager and get everything lined up for a […]
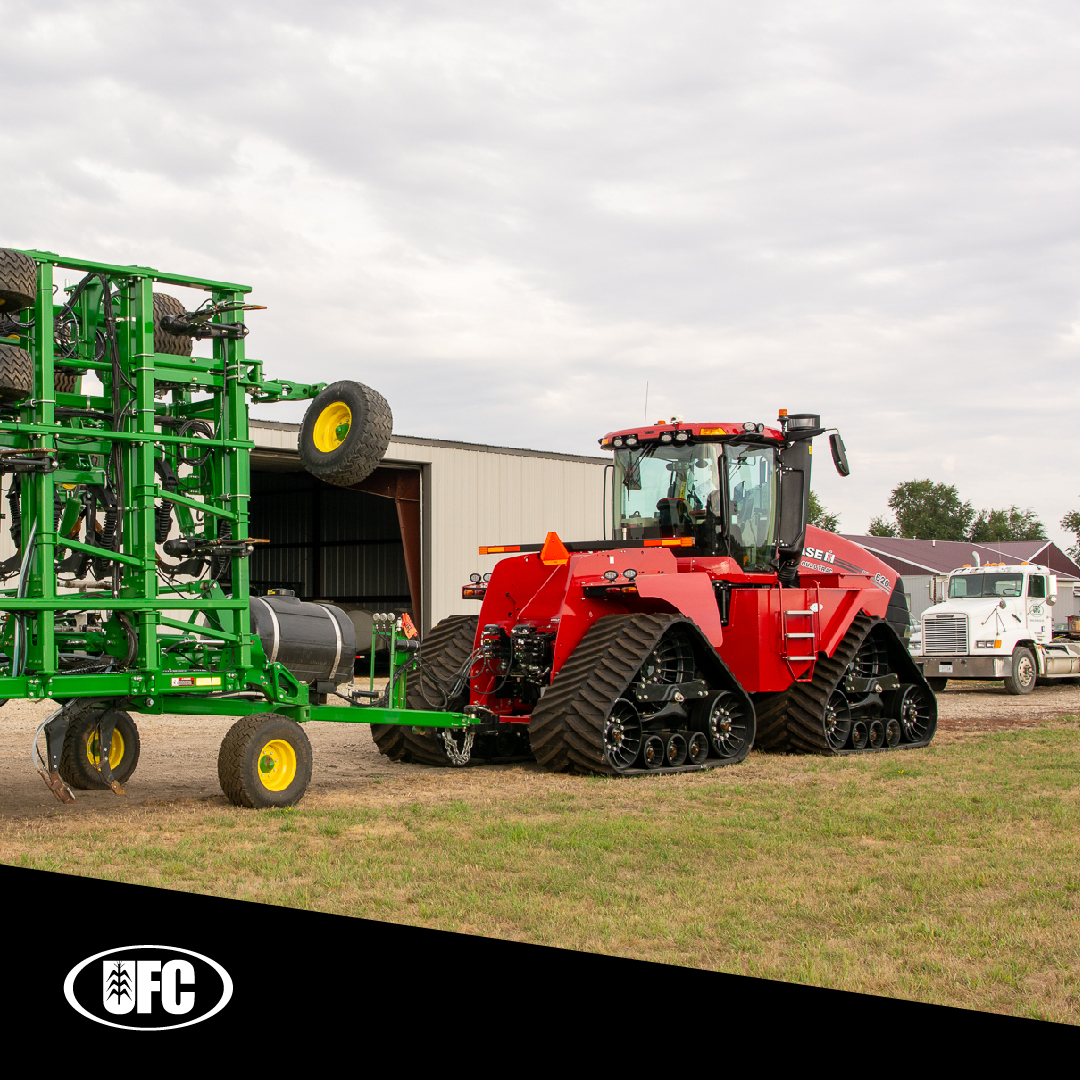
CHAD WILSON, VICE PRESIDENT OF AG SERVICES, LAFAYETTE After experiencing extended delays and shortages across nearly all equipment lines over the past three years, I’m happy to report that our inventory situation has dramatically improved. We now have many key […]
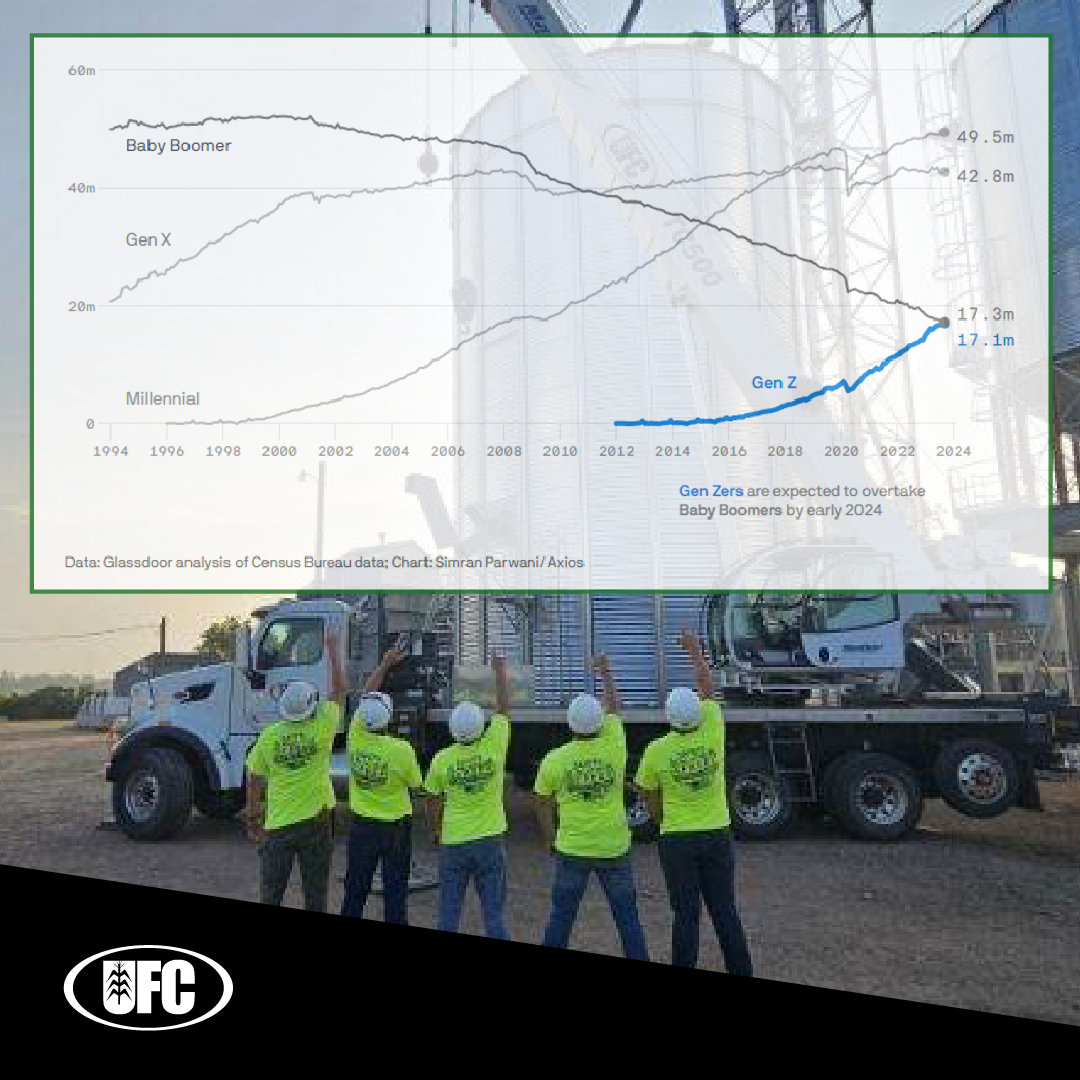
JONATHAN OLMSCHEID, CHIEF FINANCIAL OFFICER The last year has gone by quickly. The volatility in the markets and businesses we all operate within daily contribute to the fast pace. As years continue to click off, more and more Baby Boomers […]
MITCH ALTERMATT, CEO & GENERAL MANAGER From skyrocketing input costs to supply chain disruptions and volatile commodity prices, there’s no doubt that U.S. agriculture is facing significant headwinds. And, there’s no sign of this letting up. At United Farmers Cooperative, […]
JEFF MANDERSCHEID, CHAIRMAN OF THE BOARD, UFC It’s an undeniable truth that what goes up must come down, and this adage holds true for the commodity markets and our industry as a whole. While the past five years have been […]
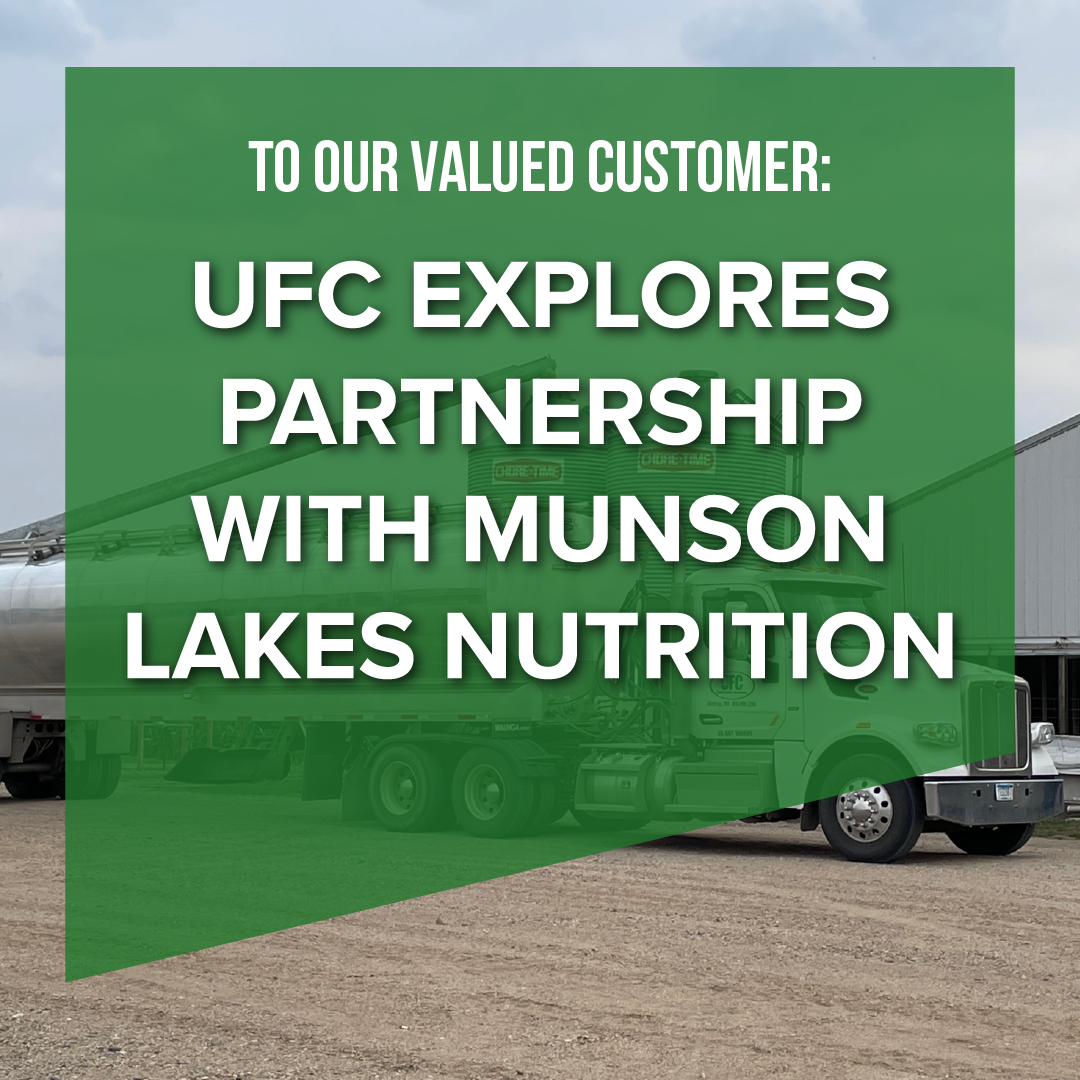
At United Farmers Cooperative, we are constantly seeking opportunities to enhance our services and better serve our farming community. With great excitement, we announce that we are exploring a partnership with Munson Lakes Nutrition, specifically for our feed department, focusing […]